Grad students
Grad students · PIs managing lean grants
Grants, stipends, and industry jumps—explained with assumptions you can change.
Net Pay Estimator
Illustrative$10,453
Federal
$5,780
State
$6,503
FICA
27%
Eff. Rate
Illustrative estimate only — not tax advice. Uses simplified 2025 federal brackets and estimated state effective rates. Verify with a licensed CPA or tax professional.
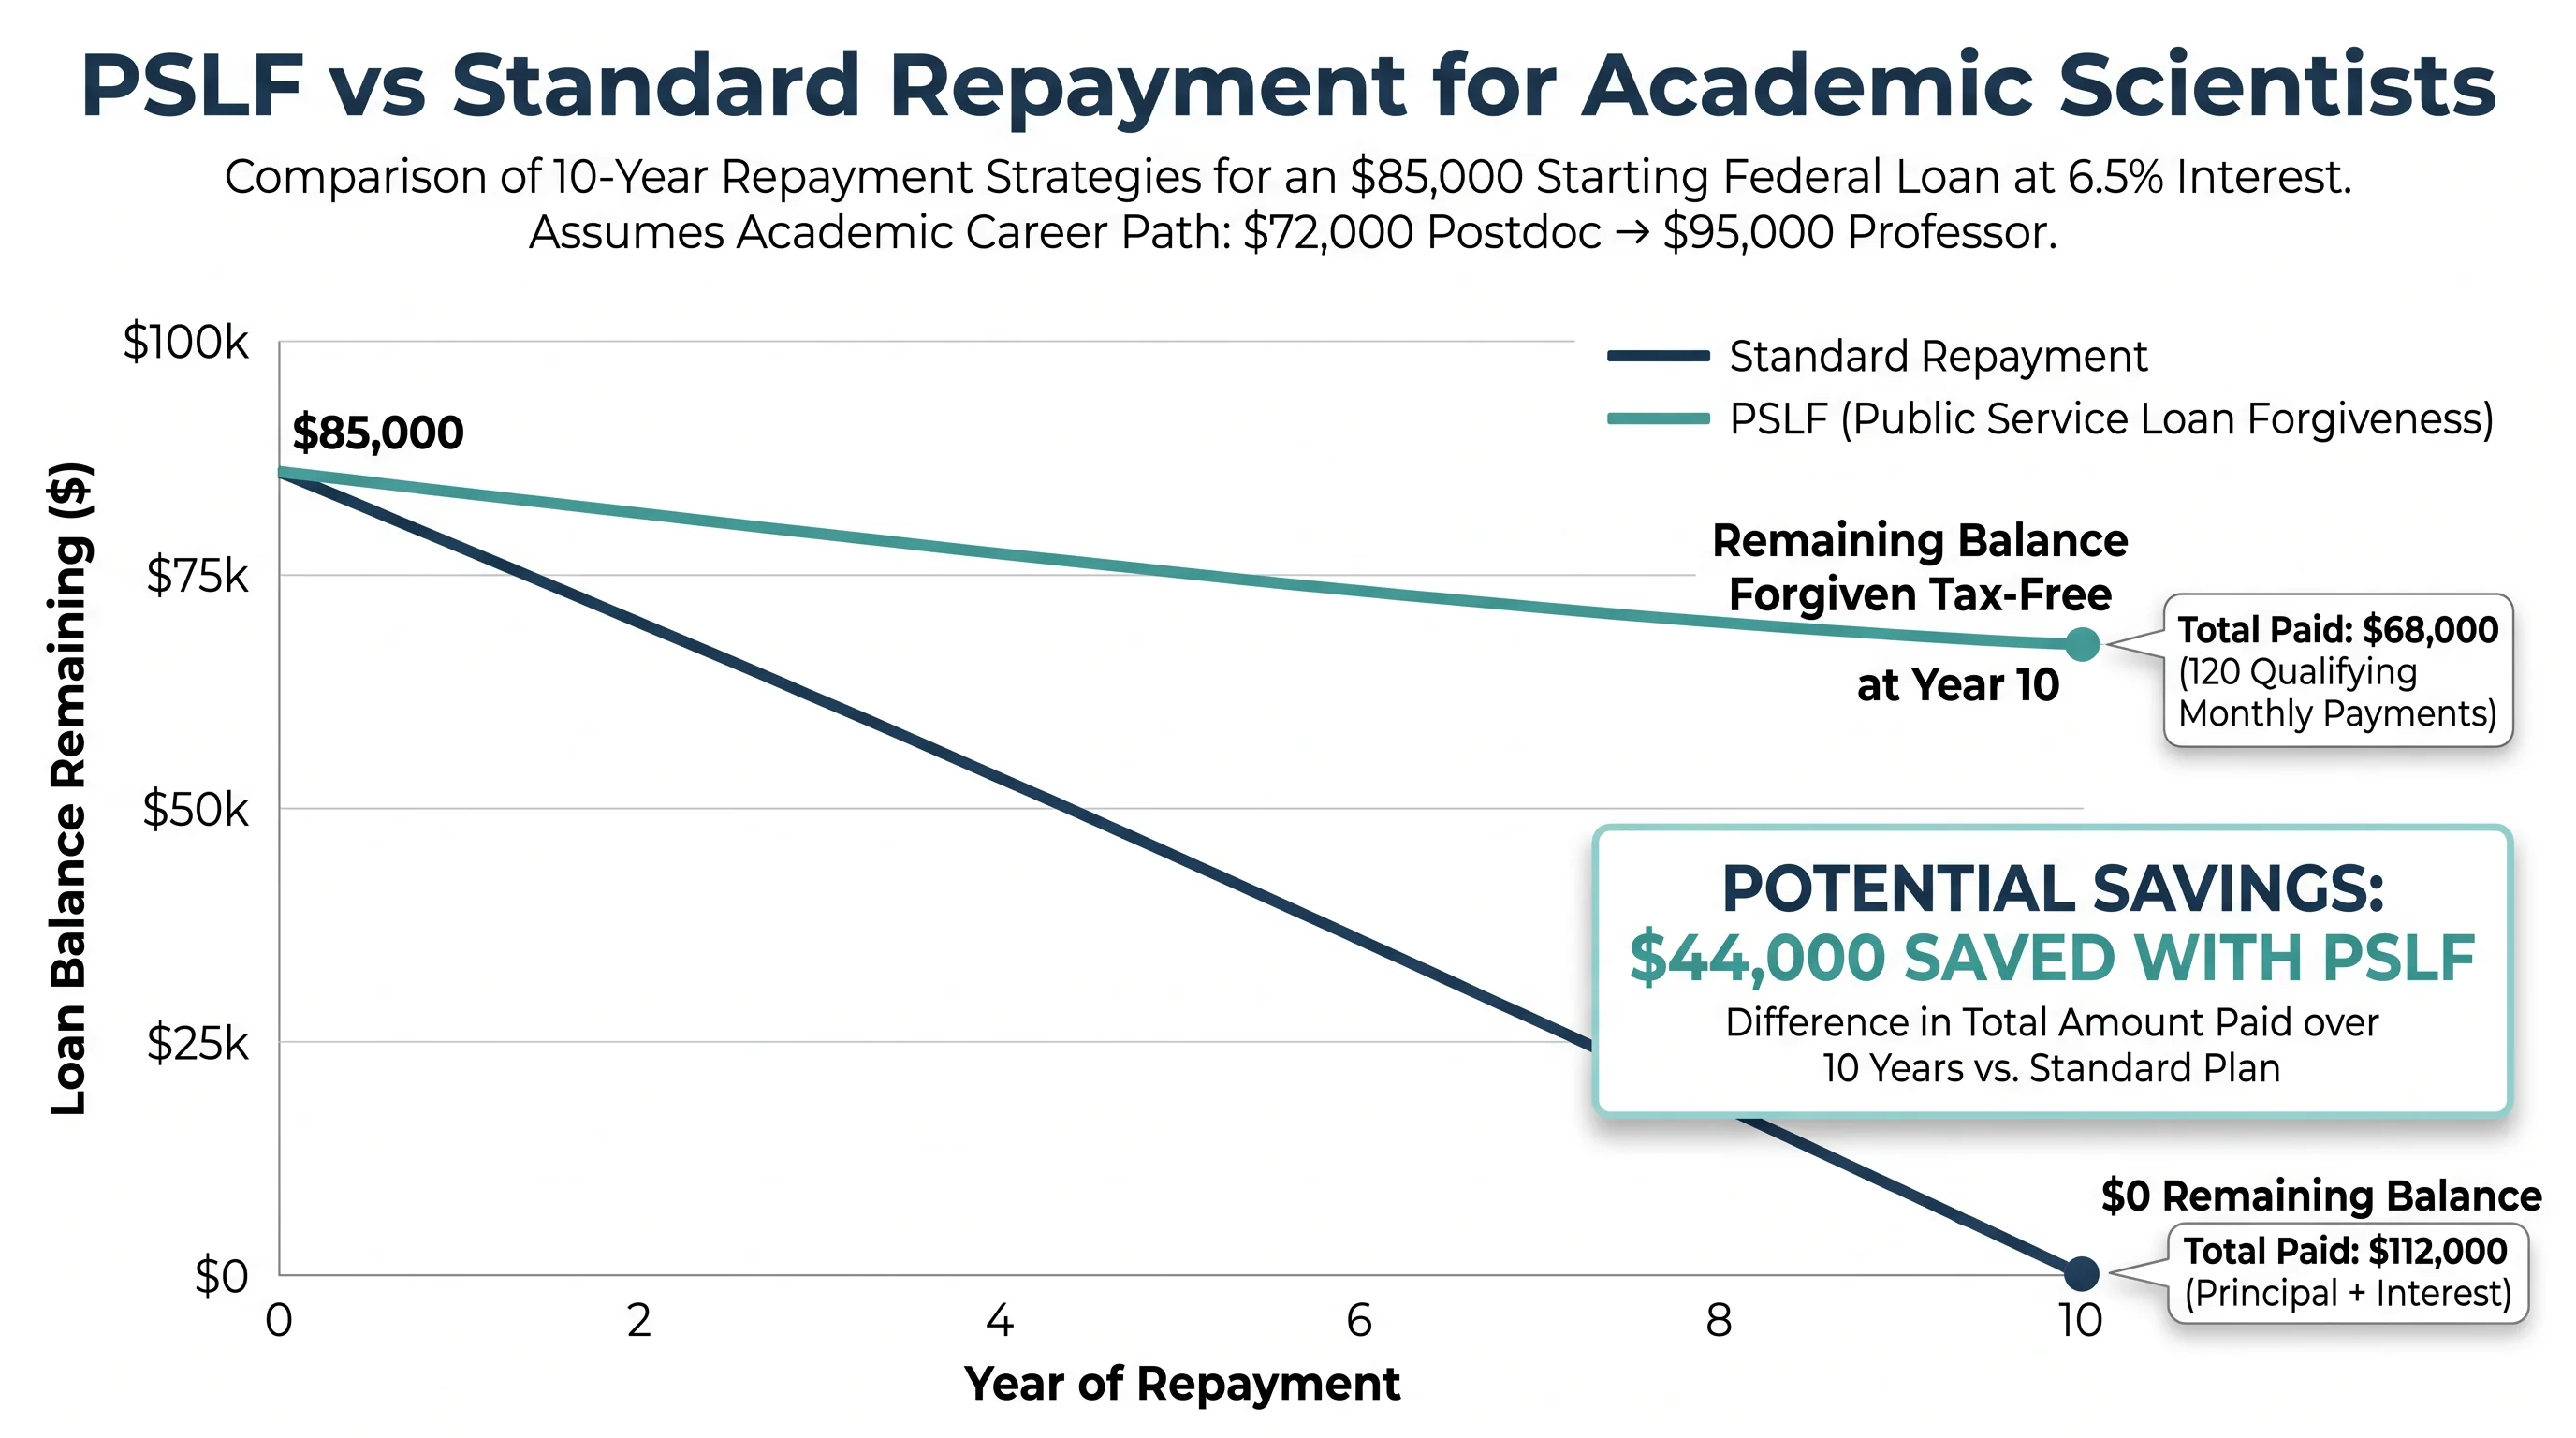
PSLF vs standard repayment for academic scientists — Illustrative. Not financial advice.
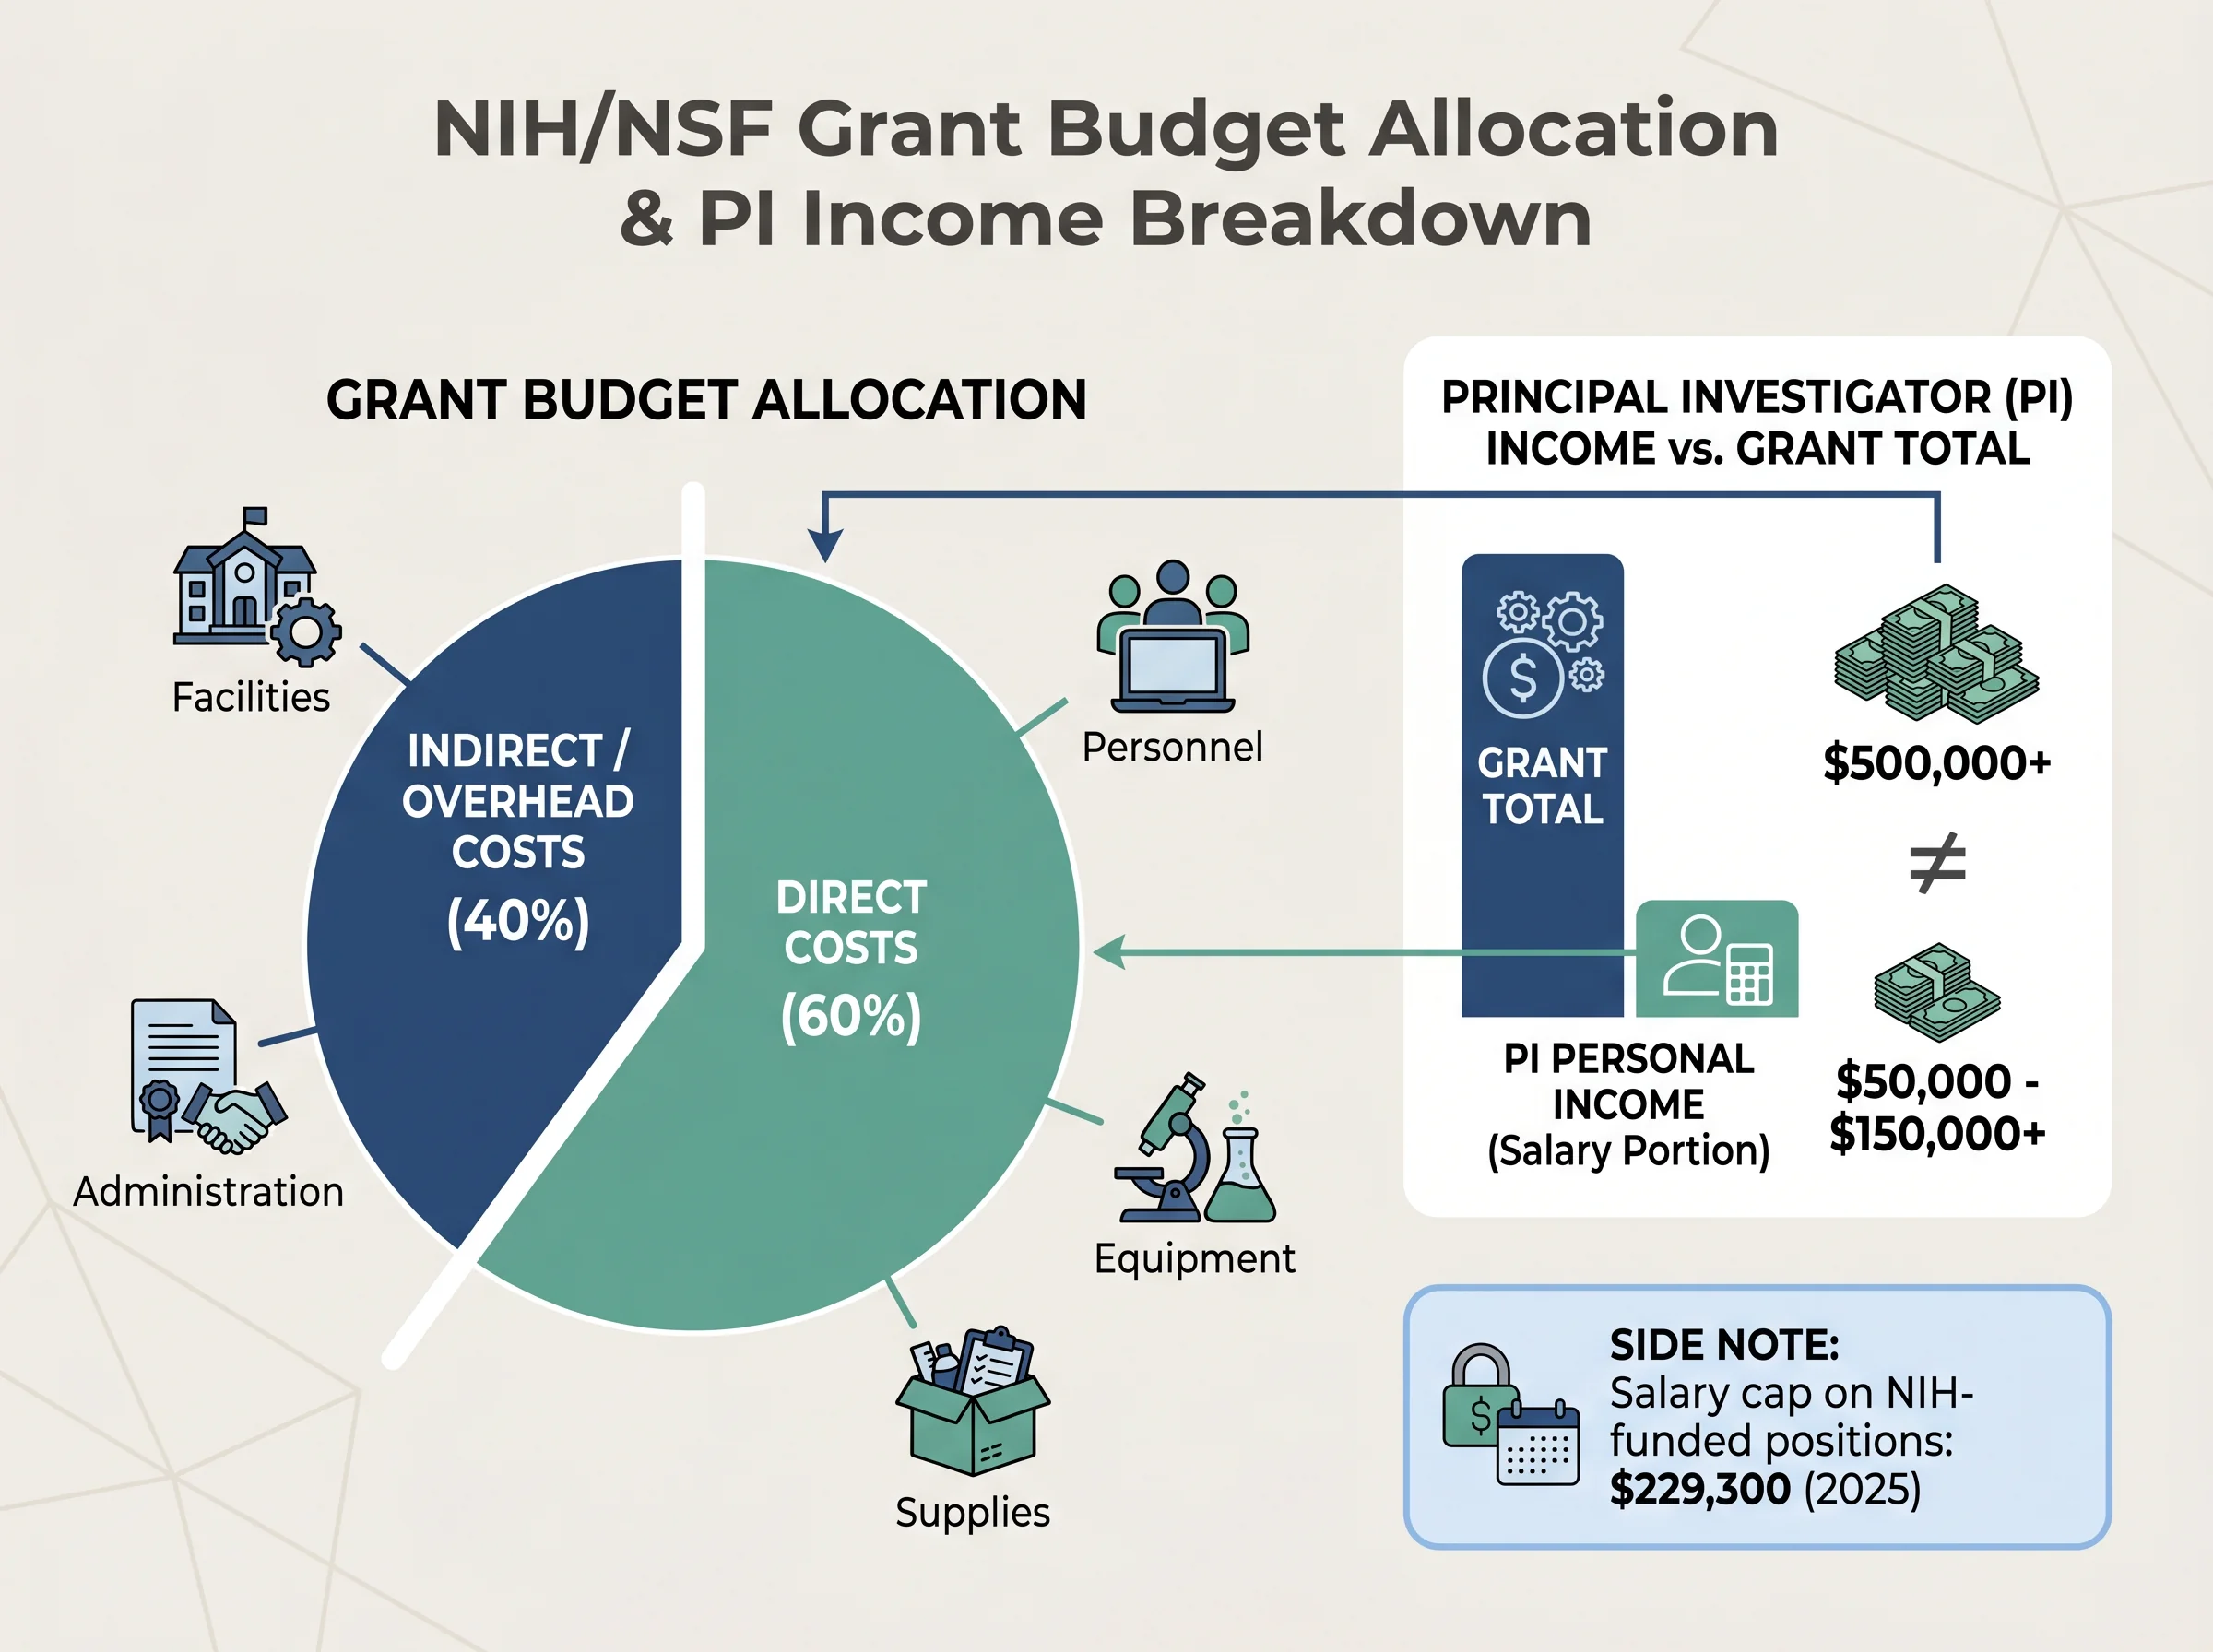
NIH/NSF grant budget — direct costs vs indirect overhead — Illustrative. Not financial advice.
What We Cover
Qualifying programs for academic and non-profit scientists
NIH salary cap, indirect cost implications, and income modeling
403(b), 457(b), pension, and TIAA-CREF optimization
Patent royalties, licensing agreements, and non-W2 planning
Academic-to-industry moves: equity, salary jumps, retirement rollover
Academic-to-Industry Transition
Moving from a $95K postdoc to a $150K industry role means a different tax bracket, loss of PSLF eligibility, and entirely new equity compensation structures. Understanding the financial implications before you move can save tens of thousands.
See the transition comparison
Practical guides and scenario tools for scientistfinance professionals — every article ships with a calculator or scenario box.
scientistfinancialadvisor.com covers postdoc stipend realities, grant overhead misconceptions, visa-sensitive employment nuances (high-level, not legal advice), moving to industry comp steps, and delayed retirement savings. Calculators use academic timeline defaults and cite all assumptions. Voice respects skepticism and prioritizes reproducibility.
Grad students · PIs managing lean grants
Postdocs · National lab staff
Bench scientists moving to industry
In practice
Translate grant-driven income, academic pay bands, and industry-transition jumps into approachable models—monetized as ads + membership with optional $99 advisor onboarding. scientistfinancialadvisor.com covers postdoc stipend realities, grant overhead misconceptions, visa-sensitive employment nuances (high-level, not legal advice), moving to industry comp steps, and delayed retirement savings. Calculators use academ
Featured tools
scientistfinancialadvisor.com readers get calculators with assumptions, language, and examples native to their career — purpose-built for this desk, not relabeled consumer-finance tools.
Interactive
scientistfinancialadvisor.com readers get calculators with assumptions, language, and examples native to their career — purpose-built for this desk, not relabeled consumer-finance tools.
Future value
$1,185,264
Projected ending balance under the current compounding path.
Your contributions
$460,000
Starting capital plus every monthly contribution.
Investment growth
$725,264
The share created by compounding instead of deposits.
Output path
The line updates immediately as you change the assumptions.
Year 0 to Year 20
Interactive
scientistfinancialadvisor.com readers get calculators with assumptions, language, and examples native to their career — purpose-built for this desk, not relabeled consumer-finance tools.
Enter current and target weights. The model normalizes them to 100% and flags any sleeve that sits outside your drift band.
equities
fixed Income
alternatives
cash
Largest sleeve
55%
Anything too dominant deserves extra governance.
Effective sleeves
2.6
A lower value means the portfolio behaves like fewer real bets.
Concentration score
0.39
Herfindahl-style concentration across the current weights.
equities
Current 55% vs target 60%
Drift: -5%. Keep this sleeve within +/-5% to stay inside the current policy.
fixed Income
Current 25% vs target 20%
Drift: 5%. Keep this sleeve within +/-5% to stay inside the current policy.
alternatives
Current 10% vs target 10%
Drift: 0%. Keep this sleeve within +/-5% to stay inside the current policy.
cash
Current 10% vs target 10%
Drift: 0%. Keep this sleeve within +/-5% to stay inside the current policy.
Interactive
scientistfinancialadvisor.com readers get calculators with assumptions, language, and examples native to their career — purpose-built for this desk, not relabeled consumer-finance tools.
Nominal balance
$3M
Raw dollars at the retirement start date.
Today's dollars
$2M
Inflation-adjusted view of the same future balance.
4% rule estimate
$130K
A quick annual draw estimate before tax planning.
Output path
The line updates immediately as you change the assumptions.
42 to 65
Sustainable real income
$112K
Approximate annual spending in today's dollars if the portfolio must last through retirement.
Membership
Reader
$0
Member
$4.99/month
Optional advisory
$99 intake
FAQ
Personal finance for people who publish methods sections—assumption tables, reproducibility, and zero mysticism.
No. Materials are general education and illustration. Decisions involving securities, taxes, or planning should involve your own licensed professionals.
Remove ads and keep sessions focused for $4.99/month; premium modules roll in over time per roadmap.
Licensing disclosures; Niche-specific limitations; Privacy
Practical guides and scenario tools for scientistfinance professionals — every article ships with a calculator or scenario box.
Contact
Standalone scientist brand. Its voice, design, and tools are built for grant-driven income, postdoc realities, and the academic-to-industry transition.
Grant income, startup equity, academic retirement plans, and non-profit wealth all operate under different rules. Fenul Wealth documents every assumption in your plan — reproducibly.
Opens fenulwealthmanagement.com · General education only · No fiduciary relationship formed on this page